Project 3
Due, in stat405 mailbox, Wednesday 30 Nov
Goals
The purpose of the project is to give you an opportunity to work on a larger analysis than what we’ve tackled in the homeworks, and for you to practice working in a group (each group will have three or four people). The main advantage to working in a group is that you can bounce ideas off one another, and hopefully uncover more interesting features of the data. The main problem, as most of you will discover, is co-ordinating time to meet together.
I expect the project to be approximately three times as much work as a normal homework. I think this is fair: you have three times as long, and you can share the work. Don’t mistake the effort you put in with the length of the final project - here are a couple of quotes to get you thinking:
“I have made this letter longer than usual, because I lack the time to make it short.” Blaise Pascal
“If I am to speak ten minutes, I need a week for preparation; if fifteen minutes, three days; if half an hour, two days; if an hour, I am ready now.” Woodrow Wilson
Data
In this project, you will perform a complete tidying, summary and visualisation on a data set of your choice. The data set should have at least 5,000 observations and 10 variables, but the choice is up to you.
You might want to start with Hadley’s data bookmarks.
Deadlines & deliverables
-
Wednesday 14 Nov. Meet with Hadley, Barret or Yeshaya to discuss your choice of dataset. (But the earlier you do this the better off you’ll be)
-
November 23 Nov: register your group for the poster session
-
Thursday 29 Nov, 4-5:30pm. Present your poster at the department poster session.
-
Friday 7 Dec. Turn in written report. Email me a copy of your code, and a pdf version of your poster and paper.
-
Friday 7 Dec. Peer rating of team members.
Grading
This project is worth 25% of your total grade. 15% will be based on your written report and 10% on your poster.
Sample projects
We used different data sets in the past, but these samples should give you a good feel for what is expected: a, b, c, d, e, f.
Some posters from 2010:
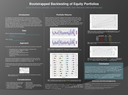 |
"Bootstrapped Backtesting of Equity Portfolios" by Dallam Masterton, Sarah Tooth, Sean Wilkinson. | 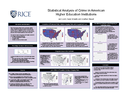 |
"Statistical Analysis of Crime in American Higher Education Institutions", by Jack Lynch, Kayla Schaefer, Jonathan Stewart. |
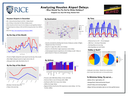 |
"Analyzing Houston Airport Delays - When Should You Fly Out for Winter Holidays?", by Sangyoon Lee, Hyun Bin Kang, Heewon Park. | 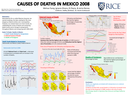 |
"Causes of deaths in Mexico", by Melissa Tsang, Ignacio Olivera, Eli Payne, Jaime Ramos |
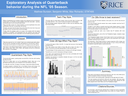 |
"Exploratory Analysis of Quarterback behavior during the NFL ’05 Season.", Matthew Burstein, Benjamin White, Max Richards | 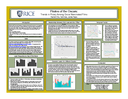 |
"Pirates of the Oscars: Trends in Piracy Among Oscar Nominated Films", by Rachel Chiu, Yanli Gao, James Rigby |
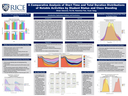 |
"A Comparative Analysis of Start Time and Total Duration Distributions of Notable Activities by Student Status and Class Standing", by Brian Vanover, Fei Ni, Hsienhui Pan, Xuan Yang | 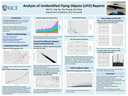 |
"Analysis of Unidentified Flying Objects (UFO) Reports", by Wei Fu, Yue Hu, Yan Huang, Rui Yang |